BlendIT - BSD Cafe
  • Communities
  • Create Post
  • heart
    Support Lemmy
  • search
    Search
  • Login
  • Sign Up
The Picard Maneuver to Data is Beautiful@lemmy.worldEnglish • 8 months ago

Homicide Rate in Europe (by country) and the USA (by state) in 2020

lemmy.world

message-square
132
fedilink
463

Homicide Rate in Europe (by country) and the USA (by state) in 2020

lemmy.world

The Picard Maneuver to Data is Beautiful@lemmy.worldEnglish • 8 months ago
message-square
132
fedilink
  • Diplomjodler
    link
    fedilink
    English
    30•8 months ago

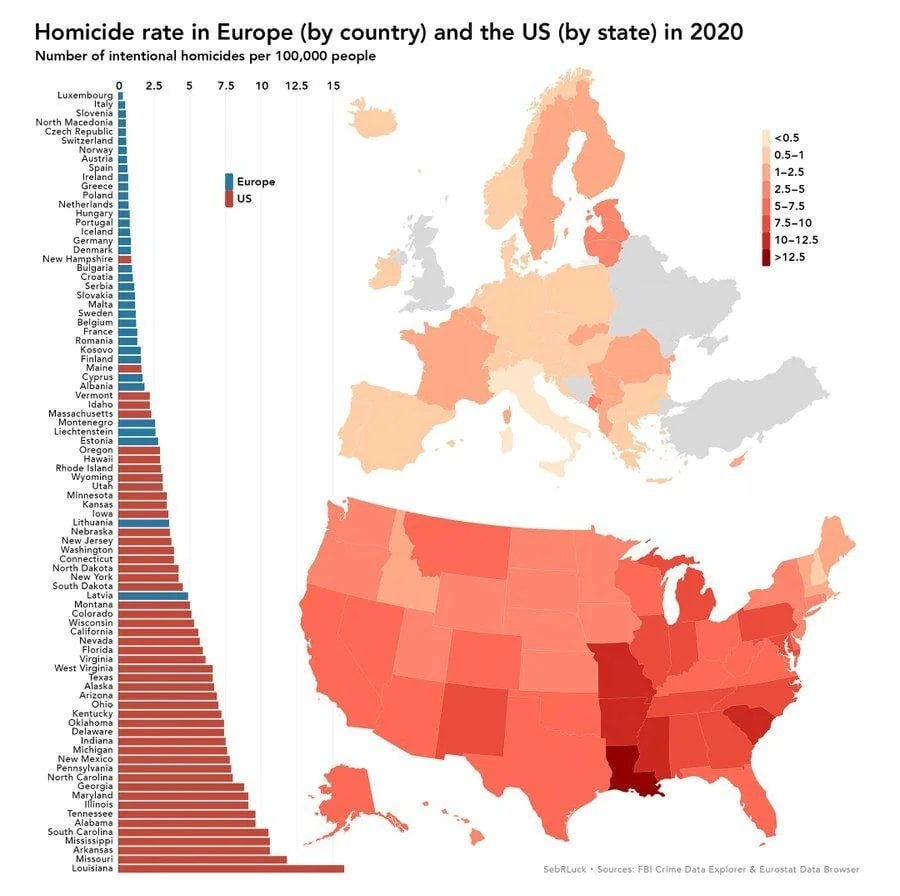
    What’s the deal with Louisiana?

    • @Dudewitbow@lemmy.zip
      link
      fedilink
      English
      53•8 months ago

      outside of NO, the region is reletively low on education, poverty ridden and low opportunity. its the trio that makes high homicide rate.

      • @sangriaferret@sh.itjust.works
        link
        fedilink
        English
        7•8 months ago

        Oh there’s plenty of people killing each other in the city too.

      • @CrayonRosary@lemmy.world
        link
        fedilink
        English
        4•8 months ago

        reletively low on education

        You don’t say

    • @doggle@lemmy.dbzer0.com
      link
      fedilink
      English
      27•8 months ago

      Corruption, poor education, overpowered oil/gas lobby, for-profit prison system that encourages recidivism

      And that’s just scratching the surface

    • @PriorityMotif@lemmy.world
      link
      fedilink
      English
      13•8 months ago

      deleted by creator

      • @usualsuspect191@lemmy.ca
        link
        fedilink
        English
        19•8 months ago

        I remember reading something while ago that did link high temperatures with higher rates of things like violence. Essentially, being hot all the damn time makes everyone’s baseline level of irritability higher and so things escalate more often. Seems a bit counter-intuitive though if we all came from Africa so I’m not sure how true it ultimately is.

        • @Obi@sopuli.xyz
          link
          fedilink
          English
          5•8 months ago

          In Europe the stereotype is definitely that “blood gets warmer” the more south you go. It certainly holds a bit of truth in my experience, the attitudes in Marseille or Rome are much more spicy than in Berlin, Amsterdam etc.

    • @Grandwolf319@sh.itjust.works
      link
      fedilink
      English
      3•8 months ago

      Wasn’t that where true detective season 1 was based in? Says all you need to know.

    • @linkshulkdoingit69@lemmy.nz
      link
      fedilink
      English
      3•8 months ago

      Get killed… Louisiana fast

    • @SpruceBringsteen@lemmy.world
      link
      fedilink
      English
      2•8 months ago

      Think 15 milly

    • @bitchkat@lemmy.world
      link
      fedilink
      English
      1•8 months ago

      Must be the Mississipi River. It just gets redder as you go down from Minnesota to Louisiana.

Data is Beautiful@lemmy.world

!dataisbeautiful@lemmy.world

Subscribe from Remote Instance

Create a post
You are not logged in. However you can subscribe from another Fediverse account, for example Lemmy or Mastodon. To do this, paste the following into the search field of your instance: !dataisbeautiful@lemmy.world

A place to share and discuss visual representations of data: Graphs, charts, maps, etc.

DataIsBeautiful is for visualizations that effectively convey information. Aesthetics are an important part of information visualization, but pretty pictures are not the sole aim of this subreddit.

A place to share and discuss visual representations of data: Graphs, charts, maps, etc.

  A post must be (or contain) a qualifying data visualization.

  Directly link to the original source article of the visualization
    Original source article doesn't mean the original source image. Link to the full page of the source article as a link-type submission.
    If you made the visualization yourself, tag it as [OC]

  [OC] posts must state the data source(s) and tool(s) used in the first top-level comment on their submission.

  DO NOT claim "[OC]" for diagrams that are not yours.

  All diagrams must have at least one computer generated element.

  No reposts of popular posts within 1 month.

  Post titles must describe the data plainly without using sensationalized headlines. Clickbait posts will be removed.

  Posts involving American Politics, or contentious topics in American media, are permissible only on Thursdays (ET).

  Posts involving Personal Data are permissible only on Mondays (ET).

Please read through our FAQ if you are new to posting on DataIsBeautiful. Commenting Rules

Don't be intentionally rude, ever.

Comments should be constructive and related to the visual presented. Special attention is given to root-level comments.

Short comments and low effort replies are automatically removed.

Hate Speech and dogwhistling are not tolerated and will result in an immediate ban.

Personal attacks and rabble-rousing will be removed.

Moderators reserve discretion when issuing bans for inappropriate comments. Bans are also subject to you forfeiting all of your comments in this community.

Originally r/DataisBeautiful

  • 9 users / day
  • 51 users / week
  • 61 users / month
  • 2.65K users / 6 months
  • 6.44K subscribers
  • 66 Posts
  • 797 Comments
  • Modlog
  • mods:
  • Tuvan41
  • Striker
  • @the_ocs@lemmy.world
  • UI: unknown version
  • BE: 0.19.3
  • Modlog
  • Instances
  • Docs
  • Code
  • join-lemmy.org