BlendIT - BSD Cafe
  • Communities
  • Create Post
  • heart
    Support Lemmy
  • search
    Search
  • Login
  • Sign Up
@kingofras@lemmy.world to Data is Beautiful@lemmy.worldEnglish •
edit-2
3 months ago

Project 2025 • Realtime progress tracker

lemmy.world

message-square
83
fedilink
781

Project 2025 • Realtime progress tracker

lemmy.world

@kingofras@lemmy.world to Data is Beautiful@lemmy.worldEnglish •
edit-2
3 months ago
message-square
83
fedilink

*not the author

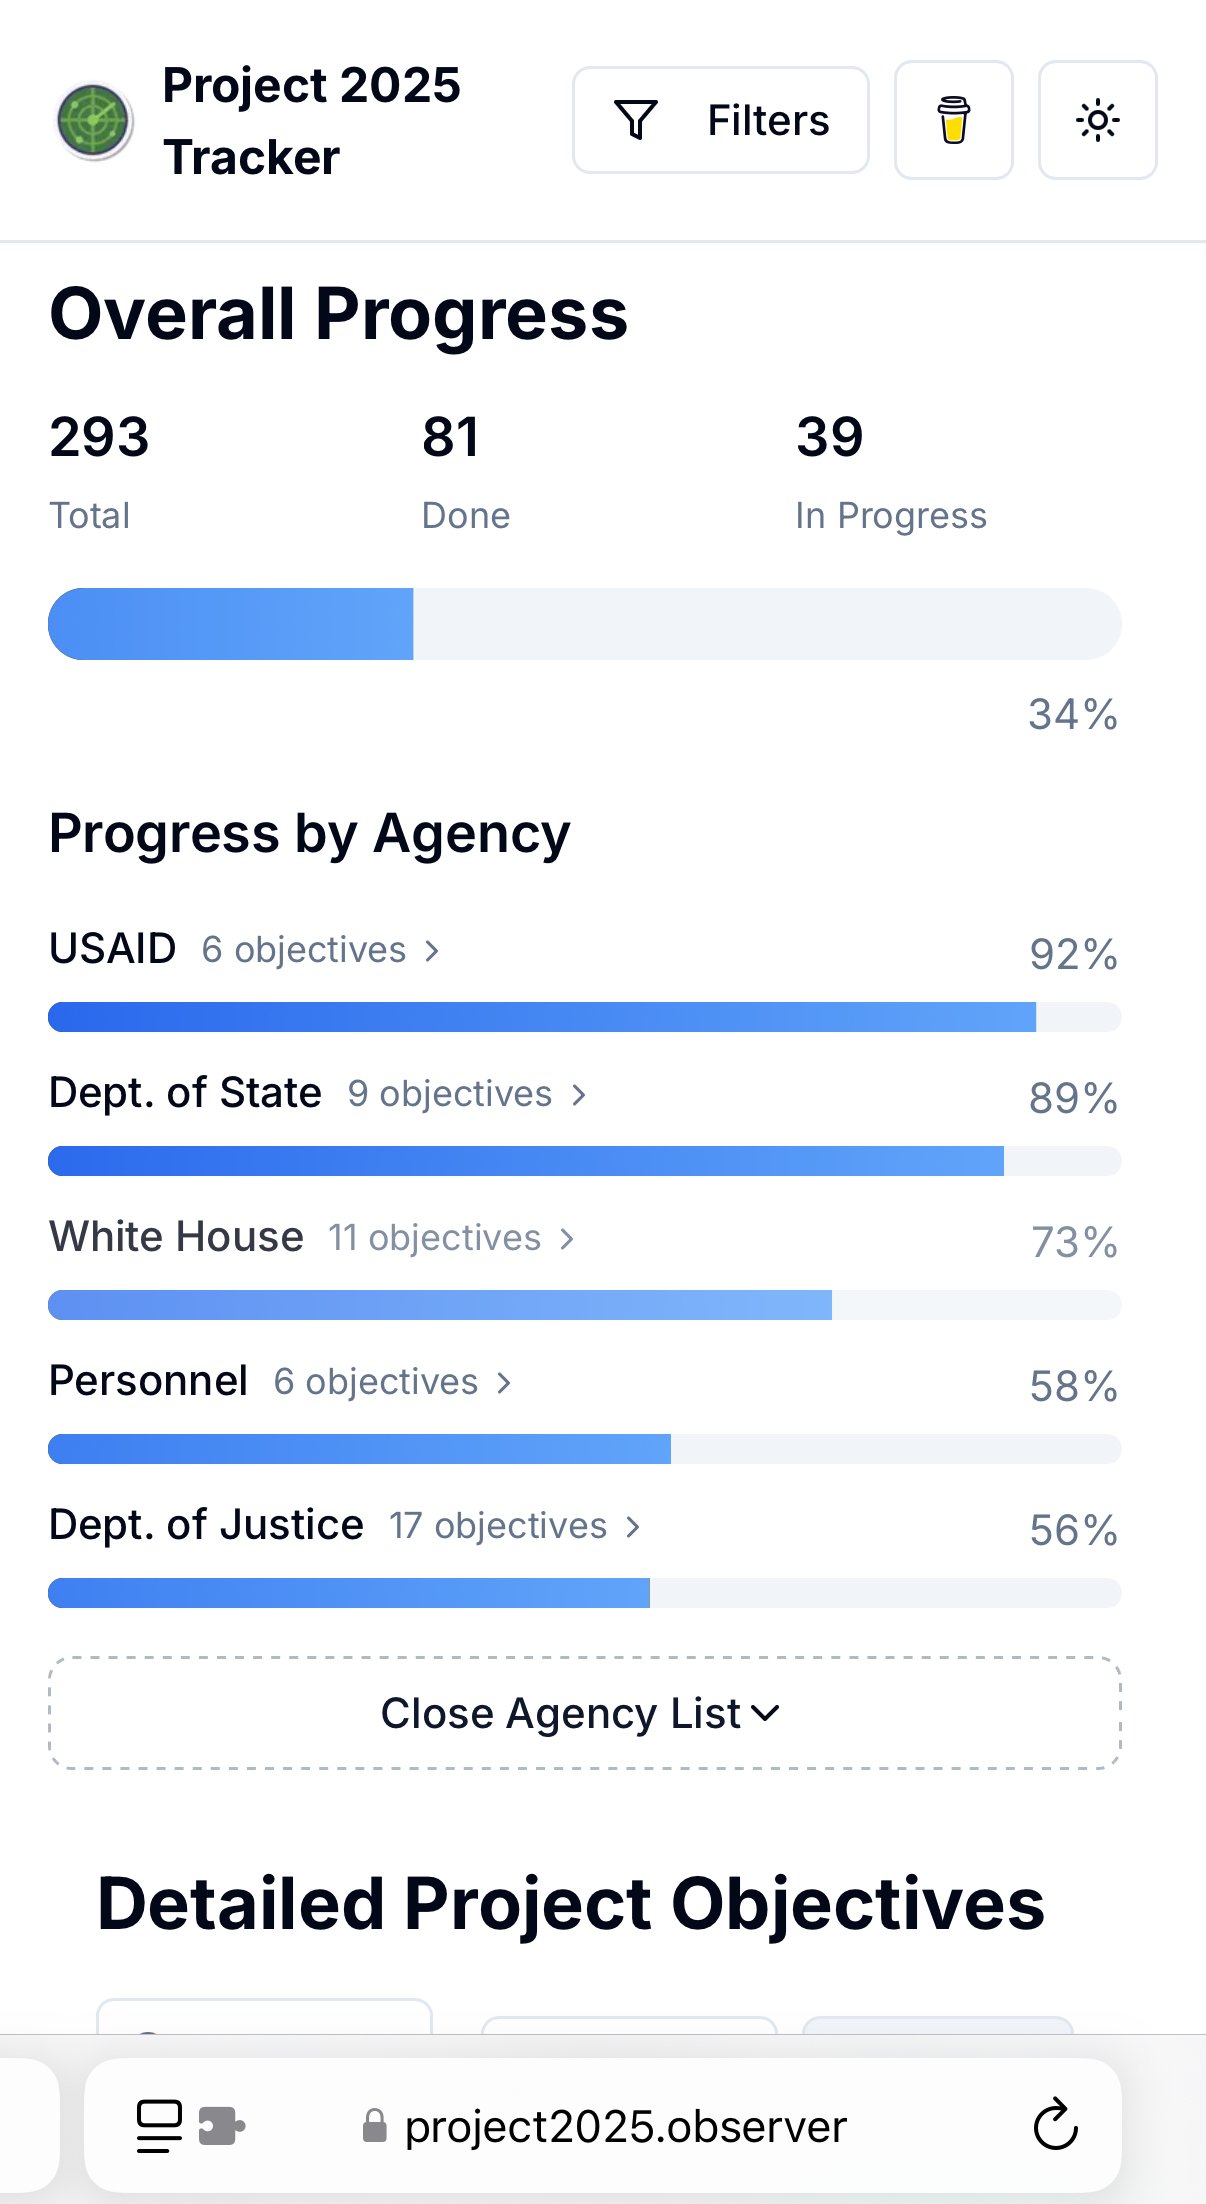
This tool live tracks the progress of the various campaigns promises that were part of the Heritage Foundation’s Project 2025 manifesto, which supported Trump during his last campaign.

Tap for spoiler

Trump denied knowing anything about the project

https://www.project2025.observer/

~Personal note: one of the authors is the mod of r/keeptrack, and I hope she strongly considers coming over here~

  • @zalgotext@sh.itjust.works
    link
    fedilink
    English
    6•3 months ago

    That’s genius. If there’s one thing I know from my time working on government contracts, it’s that the agile methodology grinds those contracts to a halt

    • @Maalus@lemmy.world
      link
      fedilink
      English
      5•3 months ago

      Agile grinds everything to a halt.

Data is Beautiful@lemmy.world

!dataisbeautiful@lemmy.world

Subscribe from Remote Instance

Create a post
You are not logged in. However you can subscribe from another Fediverse account, for example Lemmy or Mastodon. To do this, paste the following into the search field of your instance: !dataisbeautiful@lemmy.world

A place to share and discuss visual representations of data: Graphs, charts, maps, etc.

DataIsBeautiful is for visualizations that effectively convey information. Aesthetics are an important part of information visualization, but pretty pictures are not the sole aim of this subreddit.

A place to share and discuss visual representations of data: Graphs, charts, maps, etc.

  A post must be (or contain) a qualifying data visualization.

  Directly link to the original source article of the visualization
    Original source article doesn't mean the original source image. Link to the full page of the source article as a link-type submission.
    If you made the visualization yourself, tag it as [OC]

  [OC] posts must state the data source(s) and tool(s) used in the first top-level comment on their submission.

  DO NOT claim "[OC]" for diagrams that are not yours.

  All diagrams must have at least one computer generated element.

  No reposts of popular posts within 1 month.

  Post titles must describe the data plainly without using sensationalized headlines. Clickbait posts will be removed.

  Posts involving American Politics, or contentious topics in American media, are permissible only on Thursdays (ET).

  Posts involving Personal Data are permissible only on Mondays (ET).

Please read through our FAQ if you are new to posting on DataIsBeautiful. Commenting Rules

Don't be intentionally rude, ever.

Comments should be constructive and related to the visual presented. Special attention is given to root-level comments.

Short comments and low effort replies are automatically removed.

Hate Speech and dogwhistling are not tolerated and will result in an immediate ban.

Personal attacks and rabble-rousing will be removed.

Moderators reserve discretion when issuing bans for inappropriate comments. Bans are also subject to you forfeiting all of your comments in this community.

Originally r/DataisBeautiful

  • 11 users / day
  • 11 users / week
  • 962 users / month
  • 3.42K users / 6 months
  • 5.96K subscribers
  • 59 Posts
  • 743 Comments
  • Modlog
  • mods:
  • Tuvan41
  • Striker
  • @the_ocs@lemmy.world
  • UI: unknown version
  • BE: 0.19.3
  • Modlog
  • Instances
  • Docs
  • Code
  • join-lemmy.org